Website Suspended for High Resource Usage?
How to Fix Shared Hosting Limits
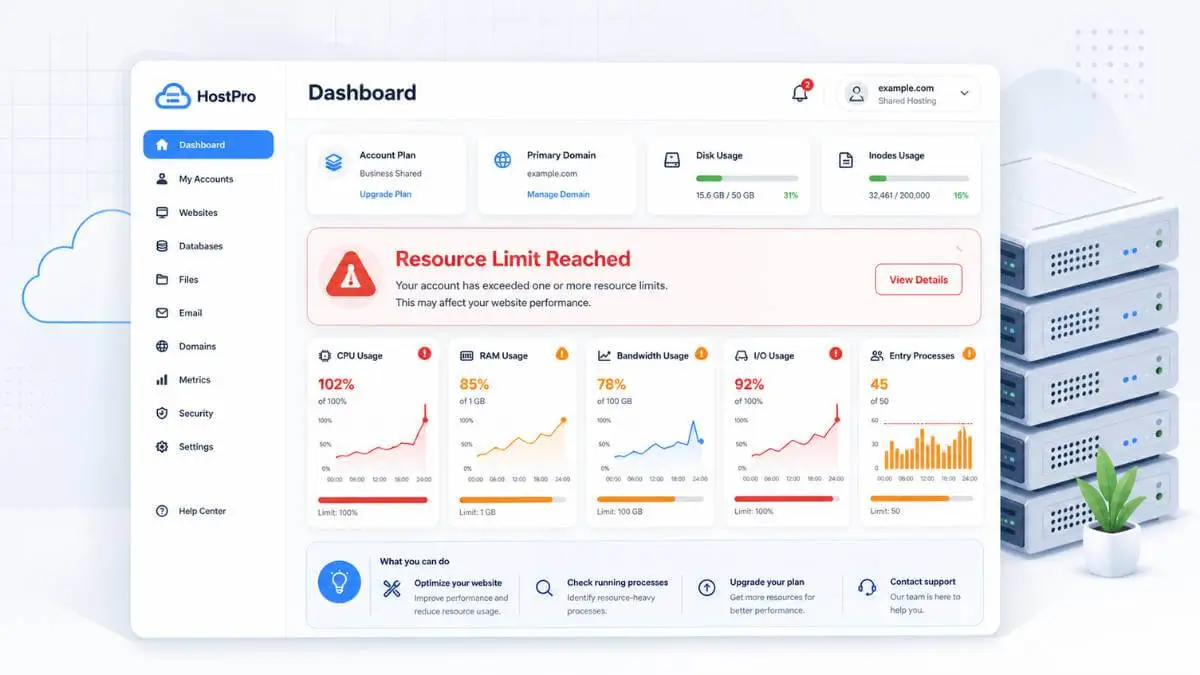
Seeing a "Resource Limit Reached" message can make your stomach drop.
One minute your site is working. The next, visitors are seeing an error page, your WordPress admin is crawling, or your host has sent an email saying your website was suspended for high resource usage.
It feels personal — but most of the time, it is not.
Shared hosting works a bit like living in an apartment building. You get your own unit, but you still share the building's plumbing, electricity, elevators, parking, and hallways. If one tenant uses everything at once, the rest of the building suffers. Hosting works the same way.
Your website shares server power with many other websites. When your site uses too much CPU, memory, disk speed, or too many active processes, the host steps in. Sometimes that means slowing your site down. Sometimes it means showing a 508 error. Sometimes it means temporarily suspending the account.
The good news: this is usually fixable. This guide explains what shared hosting resource limits are, why they happen, how to read them in cPanel, and what to do when your site hits the wall.
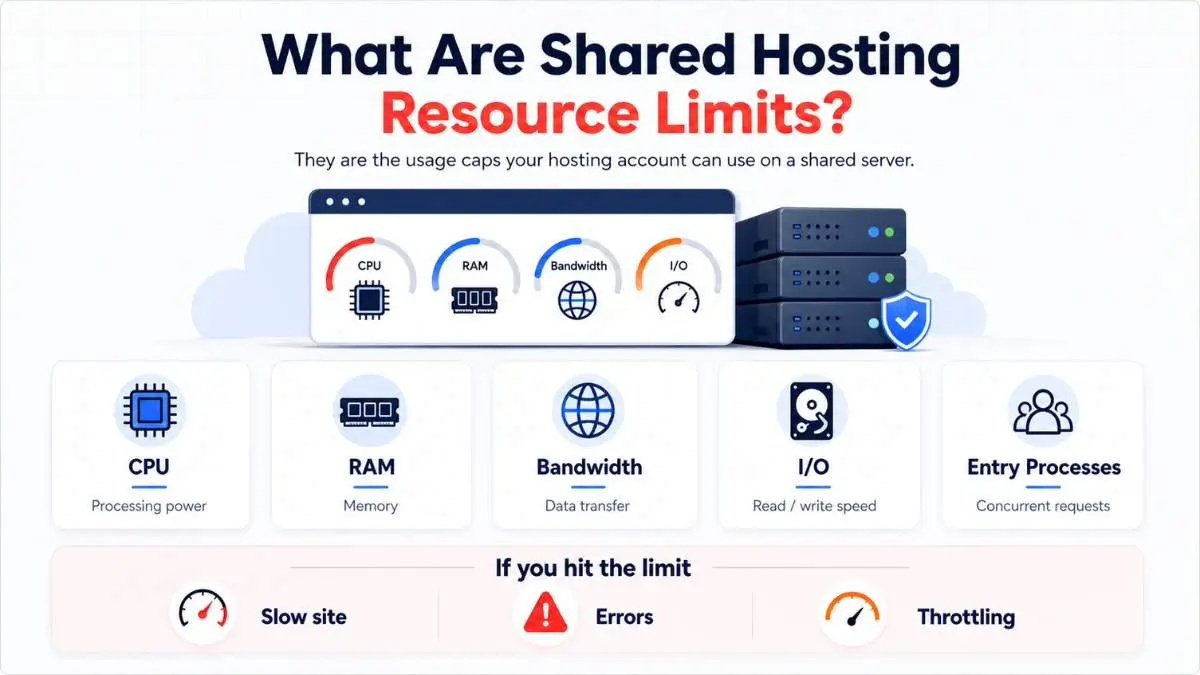
What Are Shared Hosting Resource Limits?
Shared hosting is affordable because many websites live on the same physical server. Instead of giving one customer the whole machine, the hosting company divides the server between many accounts. Each account gets a slice of CPU, memory, disk I/O, processes, and bandwidth.
Many shared hosts use systems like CloudLinux LVE to control this. LVE is a lightweight, container-like technology designed to stop one website from using all CPU, I/O, memory, or Apache processes on a server. When limits are reached, the site may slow down or return a 508 Resource Limit Reached error.
So when you see shared hosting resource limit reached, it usually means your site went over one of the limits in your hosting plan. That does not always mean your site is huge — a small WordPress site can hit limits if it has a bad plugin, a heavy theme, malware, bot traffic, or a backup job running at the wrong time.
⚠ The "Unlimited" Myth
Shared hosting is not bad — it works well for small sites, blogs, local business websites, and low-traffic projects. But "unlimited websites" and "unlimited bandwidth" almost always come with fair-use resource limits buried in the terms. No shared plan gives you unlimited server power.
The 6 Resource Limits Explained
Hosting dashboards can make resource limits look more confusing than they really are. You may see terms like CPU, PMEM, EP, I/O, IOPS, NPROC, inodes, and bandwidth. Here is what each one means in plain English — and what typically causes each to spike.
CPU Usage
The server's brain — runs PHP, queries the database, builds pages
Every time someone loads a dynamic WordPress page, submits a form, filters products, or triggers a plugin, the CPU runs PHP, talks to the database, builds the page, and sends it back. A cached page uses almost no CPU. A messy page with 30 plugins and live product filters can use a lot.
Common causes of high CPU:
Physical Memory / RAM
The server's desk space — holds data while work is being done
If CPU is the brain doing the work, RAM is the desk space where the work sits. RAM is used when PHP scripts run, plugins load, database results are processed, images are resized, or backups are created. A classic example: your backup plugin starts compressing the entire website at midnight — it uses memory, CPU, and disk I/O all at once.
Common causes of high RAM:
Entry Processes (EP)
Simultaneous PHP/Apache connections — not total visitors
EP is the one that confuses most people. It is not total visitors per day — it is the number of active dynamic requests happening at the same time. If your EP limit is 20, a visitor loading a cached page barely touches it. A visitor triggering a slow WooCommerce checkout may hold an EP slot open for several seconds.
☕ The coffee shop analogy: If each customer takes 5 seconds to order, the line moves fast. If each customer takes 2 minutes, the line backs up fast — even with the same number of people. EP works the same way. Slow scripts = slow line = limit hit faster.
What causes EP to max out:
I/O Usage
Disk read/write speed — measured in KB/sec
Every time your site loads files, writes logs, updates cache files, creates backups, reads images, or talks heavily with the database, it uses I/O. If you see exceeded I/O usage limit shared hosting, check for disk-heavy jobs. A backup running at noon when traffic is high is the most common offender.
Common I/O triggers:
Inodes
Inodes = file count. Every file, image, cache file, email, thumbnail, and log uses one. A site can hit the inode limit even with disk space to spare.
Common culprits:
- → Email stored on the host
- → Cache folders left to grow
- → Old backups never deleted
- → Stacked image thumbnails
- → Forgotten staging sites
Bandwidth
The total data transferred from your server to visitors. Big images, videos, and downloadable files add up fast. If your site sends a 5 MB page to 10,000 visitors, that is ~50 GB of transfer.
Most common causes:
- → Large unoptimized images
- → Hosted video files
- → Downloadable PDFs
- → Scrapers hitting your site
Most Common Cause of Resource Violations — Relative Frequency
Estimates based on hosting support data. Most violations are fixable before requiring an upgrade.
Why Is My Host Throttling My Website?
When you ask "why is my host throttling my website?" — the answer is nearly always one of two things: your site has a technical problem, or your site has outgrown the plan. Sometimes both are true at once.
Throttling is not a punishment. It is a protection system. On a shared server, your site lives next to hundreds of other businesses. If your account takes too much power, the host has to protect the whole neighbourhood — including yours from others doing the same thing.
The Usual Suspects — Ranked by Frequency
Poorly Coded or Outdated Plugins
Heavy database queries, constant API polling, broken link checkers scanning your whole site every hour, and page builders loaded with unused add-ons. Even well-known plugins can be expensive on a small shared plan.
No Caching — Every Visit Rebuilds the Page from Scratch
Without page caching, WordPress runs PHP, queries the database, loads plugins, and assembles the page for every single visitor. It is like printing a fresh newspaper for each reader instead of running one print run.
Bot Traffic and Brute Force Attacks
Bad bots scrape content, scan for vulnerabilities, and hammer wp-login.php thousands of times per hour. A site with 200 real daily visitors can show "high traffic" resource usage when it is really just bots.
Heavy Background Jobs During Peak Hours
Backups, security scans, email sends, product imports, and database cleanups all look invisible — but they compete directly with real visitor traffic when they fire at noon on a business day.
Legitimate Traffic Spikes
A viral post, newsletter shoutout, or flash sale can bring more visitors than shared hosting can handle — even if your site is technically optimised. That is a growth problem, not a failure. It just means it is time to move up.
Plugin types most likely to cause resource violations:
These plugins are not universally bad — many are excellent tools. But on a small shared plan, some cost more in server resources than the plan can afford. If you truly need them, you may need a bigger plan to match.
Not sure what server your site even runs on? Use the free Is It Hosted in Canada? tool to see your current hosting environment at a glance.
How to Check Resource Usage in cPanel
Before you start disabling plugins randomly, check the data. Your cPanel has a resource usage dashboard that shows which limit was hit and at exactly what time. cPanel's official documentation describes it as a full interface for viewing usage history, faults, and current consumption per resource type.
The timing of the spike is your most important clue. Do not skip this step.
Log in to cPanel
Usually at yourdomain.com/cpanel or through your host's account dashboard.
Find the Metrics or Resource Usage section
Look for Resource Usage, CPU and Concurrent Connection Usage, or Bandwidth in the Metrics section of cPanel.
Open the graphs and find the spike
Look for red lines, sharp spikes, or "fault" counts. Which limit hit first? Note the exact time.
Cross-reference with error and access logs
Open Errors and Raw Access Logs for the same timeframe. Was it a bot flood? A backup running? A WooCommerce sale? The logs tell the story.
Immediate Fixes: Get Back Online Now
When your site is down or throttled, you don't need a lecture. You need a clear action list. Here is how to fix CPU limit reached on shared hosting — or any resource violation — without losing the whole day.
Enable Page Caching — The Fastest Win
Without caching, WordPress builds every page dynamically for every visitor — running PHP, querying the database, and loading every plugin every time. With caching, visitors get a saved static HTML file instead. LiteSpeed's documentation explains how page caching can dramatically reduce CPU and EP usage for most WordPress sites.
LiteSpeed Cache
Free — best if host uses LiteSpeed
WP Rocket
Paid — beginner-friendly, excellent results
W3 Total Cache
Free — advanced controls for technical users
WP Super Cache
Free — simple, lightweight, very reliable
Disable Suspect Plugins — One Group at a Time
If your site was fine yesterday and broken today, ask what changed. Start with the heaviest plugins and temporarily disable them — do not delete yet. Check the resource graph after each group to isolate the culprit.
- Related-post and related-product plugins
- Broken link checkers (these crawl your full site constantly)
- Real-time analytics and live stats dashboards
- Backup plugins — especially if running during the day
- Heavy security scanners
- Live chat tools
- Any plugin installed or updated in the last 48 hours
- Unused page builder add-ons and extensions
Add a CDN and Basic Bot Protection
A CDN like Cloudflare serves your static files — images, CSS, JavaScript — from edge servers worldwide, so those requests never touch your shared hosting server. It also filters bot traffic before it arrives.
Quick CDN Setup Checklist
- Put the site behind Cloudflare — the free tier works well for most small sites
- Enable caching for static files (images, CSS, JS)
- Turn on bot fight mode or similar protection
- Add a rate limit on
/wp-login.phpto stop brute-force attacks - Block geographic regions you do not serve if bad traffic originates there
Block Bad IP Addresses
If access logs show one IP hitting your site hundreds of times, block it. Use cPanel's built-in IP Blocker tool, or add a rule directly to .htaccess. For Apache 2.4:
Require all granted
Require not ip 203.0.113.25
</RequireAll>
Replace the example IP with the actual offender. Never accidentally block Googlebot, Bingbot, Cloudflare IPs, your payment provider, or your own IP address.
Move Heavy Background Jobs to Quiet Hours
❌ Bad Timing
- Running backups at noon on a business day
- Scanning during an email marketing campaign
- Scheduling multiple jobs at the same time
- Running imports during peak evening hours
✅ Good Timing
- Backups: 2:00–4:00 AM, staggered
- Malware scans: after midnight
- Product imports: early morning
- Database cleanup: weekly, off-peak
If This → Then That: Which Limit? What to Check First?
| If your [limit] is high… | Check these first → |
|---|---|
| CPU | Uncached pages, heavy plugins, WooCommerce, bots, slow DB queries |
| Physical Memory (PMEM) | Heavy plugins, PHP workers, backups, security scans, page builders |
| Entry Processes (EP) | Slow PHP scripts, login attacks, admin AJAX, uncached dynamic pages |
| I/O | Backup jobs, cache rebuilding, image optimization, error log growth |
| Inodes | Email inbox size, cache folder, old backup archives, stale thumbnails |
| Bandwidth | Large image files, scrapers, hosted videos, uncompressed downloads |
Long-Term Fixes That Prevent Future Violations
The emergency steps above get you back online. But if you want to stop fighting the same battle next month, you need a proper cleanup. Think of it like a car tune-up — a bit of work upfront saves a breakdown later.
Plugin Audit
Remove plugins you do not use. Replace heavy ones with lighter alternatives. Avoid plugins that run constant live checks unless you genuinely cannot function without them.
Image Optimization
Resize images before uploading. Compress them. Convert to WebP. Lazy-load anything below the fold. Never let WordPress dynamically resize a 6 MB camera photo on every page load.
Database Cleanup
Clear old post revisions, spam comments, expired transients, and abandoned plugin tables. Always take a backup first — never run cleanup tools blind.
Cron Job Review
WordPress cron gets messy fast when many plugins schedule tasks. Ask your host about replacing WP-Cron with a real server cron that runs at controlled, staggered intervals — not all at once when someone visits the site.
Theme Evaluation
Beautiful themes can be resource hogs. Excessive JavaScript, multiple Google Font requests, CSS animations, and bloated layout files add up quickly. A lighter theme can cut CPU and RAM usage noticeably.
Log Monitoring
Your access logs reveal bots, scrapers, and broken URL patterns. Your error logs expose PHP warnings and plugin failures. Resource violations are almost never random — there is nearly always a repeating pattern if you look.
When Is It Time to Upgrade Your Hosting?
Sometimes optimization is enough. Sometimes it is not. If your site is clean, cached, updated, malware-free, and still hitting limits from real traffic — you have outgrown shared hosting. And that is not a failure. That is growth.
The only question is which path forward makes sense for your site right now.
Managed WordPress
Better caching, stronger security, staging environments, automated backups, and support that actually understands WordPress. Zero server management needed.
Best for:
- ✓ Blogs and business websites
- ✓ WooCommerce stores
- ✓ Non-technical site owners
VPS Hosting
Dedicated resources inside a virtual server. More control, more power, and room to grow. Managed VPS options require no server administration skills.
Best for:
- ✓ Developers and technical users
- ✓ Higher-traffic websites
- ✓ Custom apps and configurations
Cloud Hosting
Scales with traffic automatically. Useful for seasonal spikes, larger projects, and sites that cannot afford even a minute of downtime.
Best for:
- ✓ Apps and larger websites
- ✓ Seasonal traffic bursts
- ✓ High-availability requirements
The honest truth: shared hosting is not built for heavy WooCommerce stores, large membership sites, or resource-hungry WordPress builds. If your website generates revenue — and downtime costs you money — upgrading is almost always cheaper than fighting the same limits every single month.
Browse our independently ranked Canadian hosting providers to find the right plan for where your site is headed next — not just where it is right now.
takes 5 seconds to load
extra second on mobile
from 1s to 3s load time
Frequently Asked Questions
Find a Canadian Host Built for Your Site's Needs
Browse independently ranked Canadian hosting providers — sorted by real-world performance, privacy, and value. Find a plan built for where your site is going, not just where it is today.